Diagnostics Pane
Diagnostics Pane is the main diagnostcs tool of the PowerDesk suite.
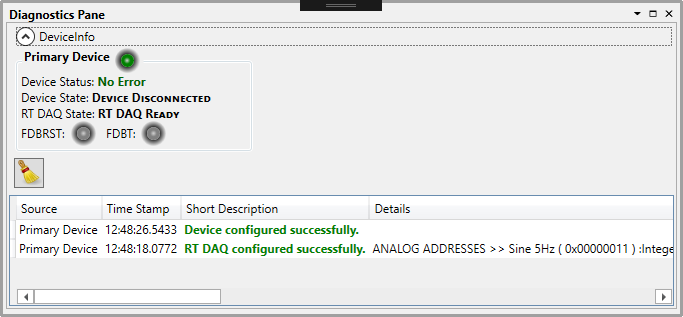
Diagnostics Pane showing two success messages.
The Diagnostics Pane has two main areas. The upper area shows basic info regarding all active devices, including device status and the status of active real-time data acquisition process. The lower part of the pane is reserved for messages. The messages are color-coded. Success messages are shown in green, while errors are shown in red. Thus, a user can notice errors quickly and efficiently.