PowerDesk Scope
Basic Info
Scope is the main visualization tool of the PowerDesk suite. Its primary purpose is to show various signals and spectra. In conjunction with other PowerDesk components, it supports visualization of live data as well. This means that Scope enables you to see the data as they arrive when Real-Time Data Acquisition function is active.
The Scope component is developed atop the OxyPlot library (see http://oxyplot.org/) and is tightly related to Dynamic Systems Toolkit, a PowerDesk component responsible for live signal processing (see Signal Processing and Analysis). Although Scope comes in several varieties, each one consists of the same main parts.
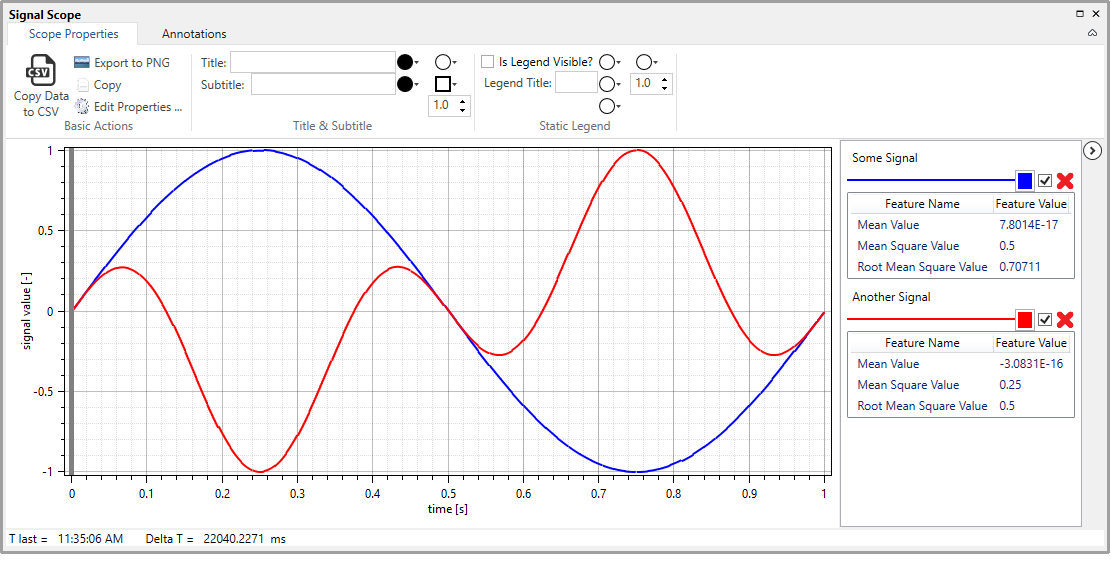
Signal Scope component showing two signals. The Dynamic Legend component is shown on the right. Scope Ribbon is shown on the top, while Scope Status Bar is shown in the bottom. The Plot itself fills the rest of the area.
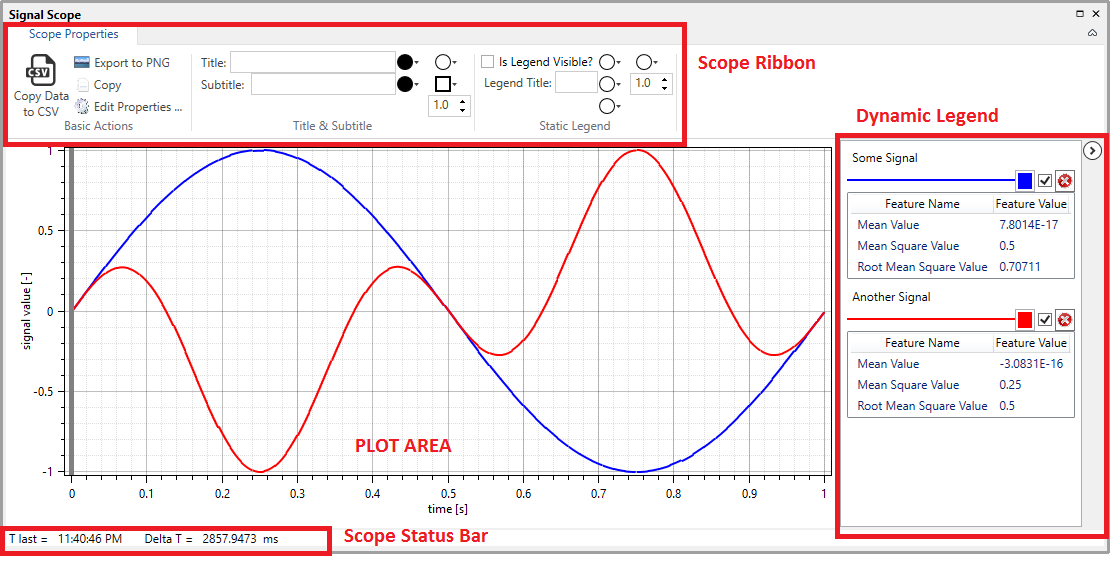
Signal Scope component with the most significant elements highlighted.
As indicated in the figures, each Scope has four main parts:
Plot, which is the principal part actually showing signals and spectra. The plot fills most of the scope area, and it supports panning and zooming functionality, using appropriate keyboard and mouse gestures. In addition, the data-tracker functionality enables instantaneous access to values of individual points of the shown signals and spectra.
Dynamic Legend , which describes signals and spectra currently added to the plot. The dynamic legend also allows for quick adjustment of basic plot properties, including line styles, thickness and colors. It enables hiding or removing signals and spectra, and also shows some characteristic data features like mean value, mean square value, etc. The dynamic legend can be minimized in order to provide more space for the plot area, if needed.
Scope Ribbon is positioned at the top edge of the Scope area. It supports quick access to basic scope properties, including scope title, subtitle, and various other aspects of appearance. It also provides easy access to basic actions, like inserting annotations, saving plot area to
PNGformat, copying plot area or shown samples to clipboard, etc. The ribbon also enables accessing Scope Properties Editor dialog, which enables adjustment of all scope properties.Scope Status Bar is positioned on the bottom. It shows the time-stamp of the last update action (T last), as well as the time elapsed between the last two consecutive updates (Delta T). These information are precious during a live update session, i.e. when the Real-Time Data Acquisition Function is active. As needed, the status bar may also be used to display other information as well.
Data Tracker
Data tracker functionality enables the user to access individual data points shown on the plot. The data tracker functionality is available by means of the left mouse button. Just press the left mouse button above the desired point of the line depicting relevant signal or spectrum, and the data tracker will be shown.
Scope component with data tracker shown.
Panning and Zooming
Plot area can shown only a detail of the data actually contained within signals and spectra depicted on the Scope. The zoom level can be set arbitrarily high. Once the desired zoom level is achieved, a user may pan left or right (or up, or down) in order to focus on a different detail.
Panning is activated by means of the right mouse button, while zooming is linked to the mouse wheel/middle mouse button.
A user can pan freely simply moving the mouse wheel. Moving the wheel forward will increase the zoom level, while moving it backward will decrease it. A user can zoom to a rectangular area by pressing the button wheel/middle button and “drawing” the rectangle on the plot area.
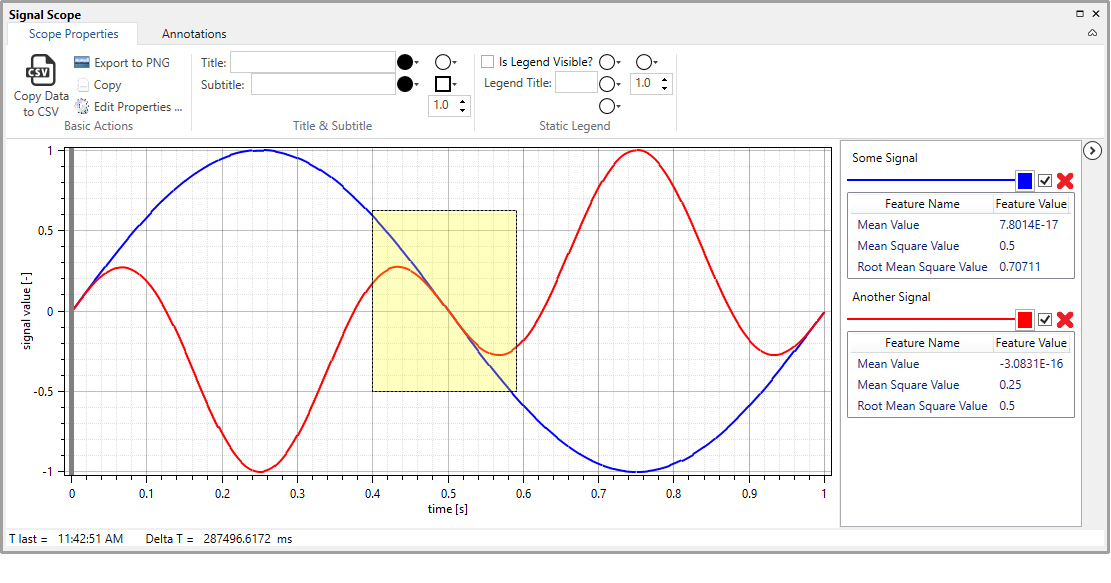
Illustration of the zoom-to-rectangle functionality.
It is possible to zoom only horizontally or vertically by positioning the mouse atop the desired axis area and moving the mouse wheel. Again, rolling the wheel forward will increase, while rolling it backward will decrease the zoom level. It is possible to zoom only to a horizontal or vertical rectangular strip simply by clicking the button wheel/middle button atop of the desired axis (vertical, or horizontal, respectively) and dragging in the desired direction.
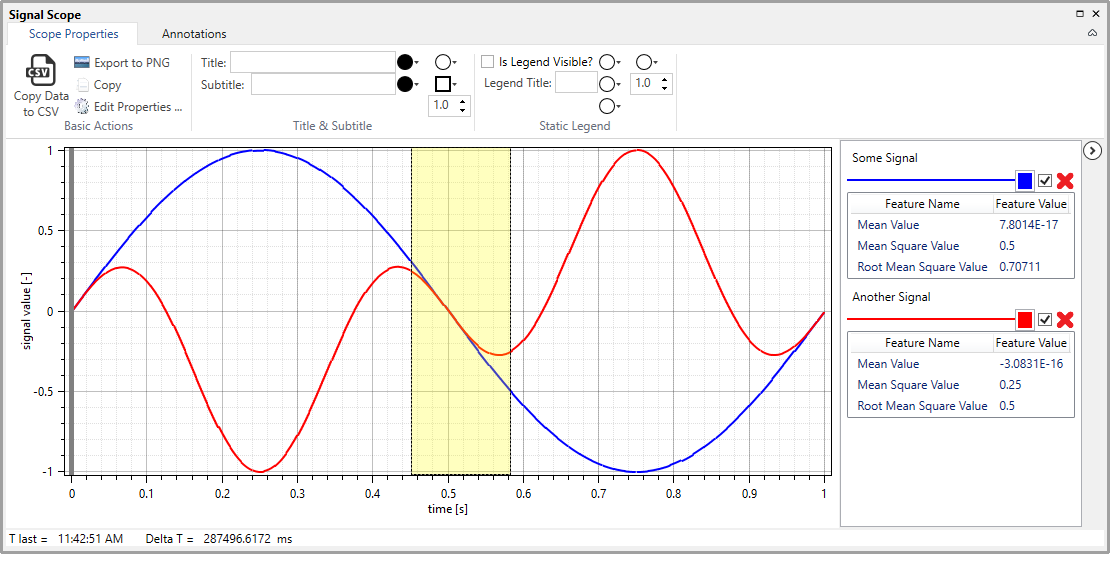
Illustration of the zoom-to-vertical-strip functionality.
The similar hold for panning, which is linked to the right mouse button. Panning is achieved by clicking the right mouse button and dragging the plot in the desired direction. If only horizontal or vertical panning is required, it is possible to right-click and drag over areas of individual axis.
Any previous panning and/or zooming actions can be reset by pressing the key A. This action will instantaneously restore the original axis ranges.
Note
Special care has been taken during the implementation of Perun Scope components showing signals and spectra to prevent panning or zooming outside the horizontal span of the data. This, in particular, means that it is impossible to pan or zoom to a time instant before the first signal data sample and after the last one. The similar holds for spectra. It is impossible to show frequencies which are smaller than the lowest, or bigger than the highest frequency present at the spectrum. This does not apply for XY Scope components.
Scope Properties
Scope properties can be adjusted by invoking the Scope Properties Editor dialog. The dialog is invoked by invoking the Edit Scope Properties command from the Scope Ribbon.
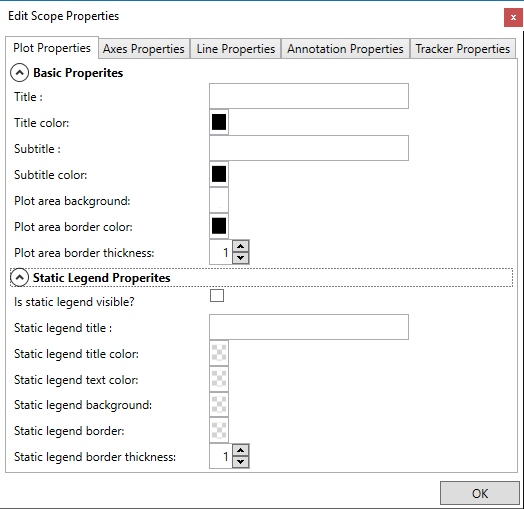
Edit Scope Properties dialog.
There are five basic groups of properties:
Plot Properties refer to some basic customizations of the plot area itself (including: plot title, color, border thickness, etc.) and customizations of the static legend.
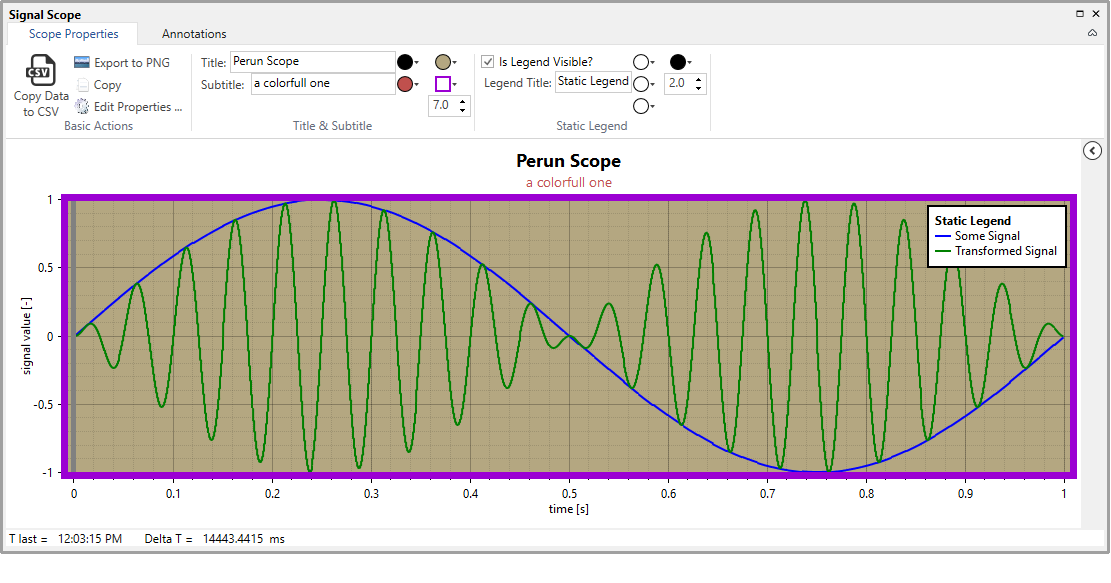
Scope with static legend shown and some basic properties adjusted. Ribbon and Dynamic Legend are minimized in order to maximize the plot area.
Axis properties refer to settings affecting axes labels, titles, units, minor and major ticks, and grid-lines.
Line properties refer to properties of lines depicting individual signals or spectra on the Scope. These include: line thickness, style, color, etc.
Annotation properties enable accessing properties of the individual annotations added to the Scope, including line-style, color and thickness. Annotation properties also enable existing annotations to be removed from the scope.
Tracker is the vertical line showing the extent of newest data on the plot. It is relevant only when showing live signals, during an active Real-Time Data-Acquisition session. In such occasions, the signal buffer may contain both samples of the newest data frame, and samples of the previous one. The samples of the last frame are stored first, and the older samples follow. The Tracker indicates where one stop and the other start. Therefore, parts of the signal shown left of the data tracker are the most recent ones, while parts of the signal shown on the right side of the tracker are older.
Scope with Tracker shown.
The Scope component is highly customizable. Almost all aspects of the appearance can be customized to meet user needs and desires.
Scope Annotations
Annotations are objects shown on the plot area which are not directly linked to signals or spectra. Although many different types of annotations may be envisioned, the Perun Scope component currently supports only inserting annotating curves.
In order to insert an annotation activate the Add Annotation command from the Annotations group of the Scope Ribbon. This command allows for choosing a CSV file holding X and Y coordinates of the desired annotation curve. The Annotations ribbon group also enables specification of the properties of the annotation before it is added to the plot. After an annotation is added, its properties can be changed by means of the Scope Properties Editor dialog.
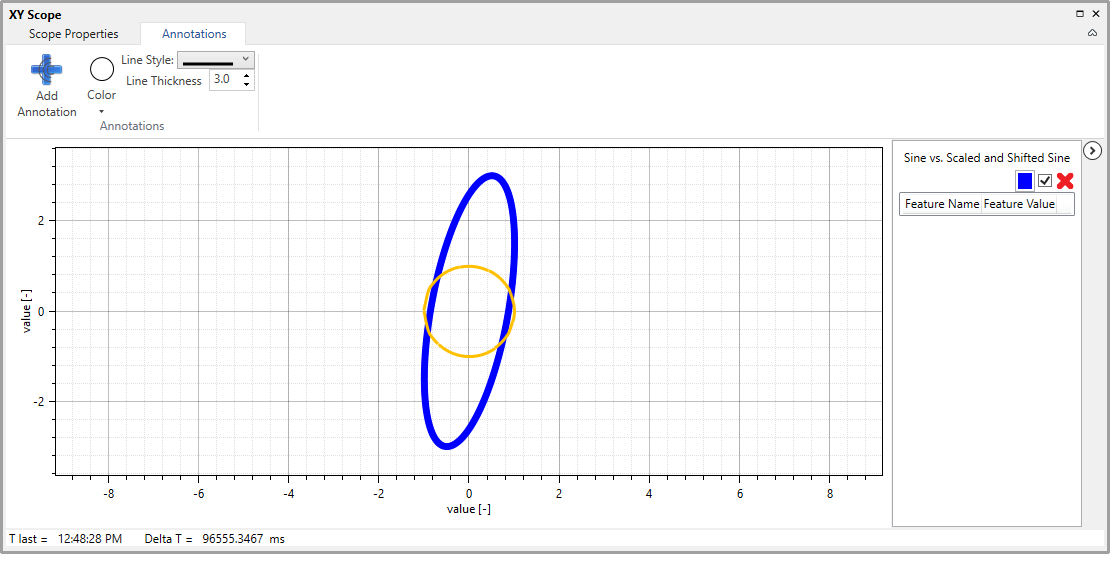
Scope with a single annotation curve (the yellow one). The picture also shows Annotations group from the Scope Ribbon.
The Scope component is highly customizable. Almost all aspects of the appearance can be customized to meet user needs and desires.
Scope Commands
There are several actions that can be invoked for any Perun Scope. For example, the plot area can be copied to clipboard as a bitmap by invoking Ctrl-C (and also by invoking the appropriate command from the Ribbon). There is also a possibility of directly saving the plot as a PNG image, as well as an option to copy only data to clipboard, in a comma-separated-values CSV format. The data can then be pasted into Microsoft Excel or other similar datasheet editor.